For end-to-end QA workflows, see QA and analytics. For programmatic export, see Call data.
How the page is organized
The page is built around three layers: channel scopes in the sidebar, your views as pinned tabs, and the conversations table that opens an integrated side panel when you click a row.Voice and webchat scopes
Conversations are split by channel. Open Analyze > Conversations in the sidebar, then use the segmented Voice | Messaging toggle in the top right to switch scope (the messaging subview is titled Messages), with channel tabs for Voice and Web chat:- Voice — voice calls logged automatically
- Web chat — webchat sessions logged automatically
Views
Each scope opens on a built-in System View by default:- Production — live environment conversations only
- Test — sandbox, draft, and pre-release conversations
Conversations table
Each row in the table is one conversation. Default visible columns are Start time (always shown), Contact, Summary, Duration, and PolyScore. Additional columns can be toggled on from the Column button.- Live calls appear at the top with a duration indicator and update as new turns arrive. See Live conversations below.
- Sort any sortable column by clicking its header.
- Select rows to create a test case batch from the toolbar.
- Click a row to open the conversation in the review side panel.
Live conversations
When any conversation is currently in progress, an “X conversations in progress” banner appears above the table with a green dot. Click the banner to open the Live conversations side panel.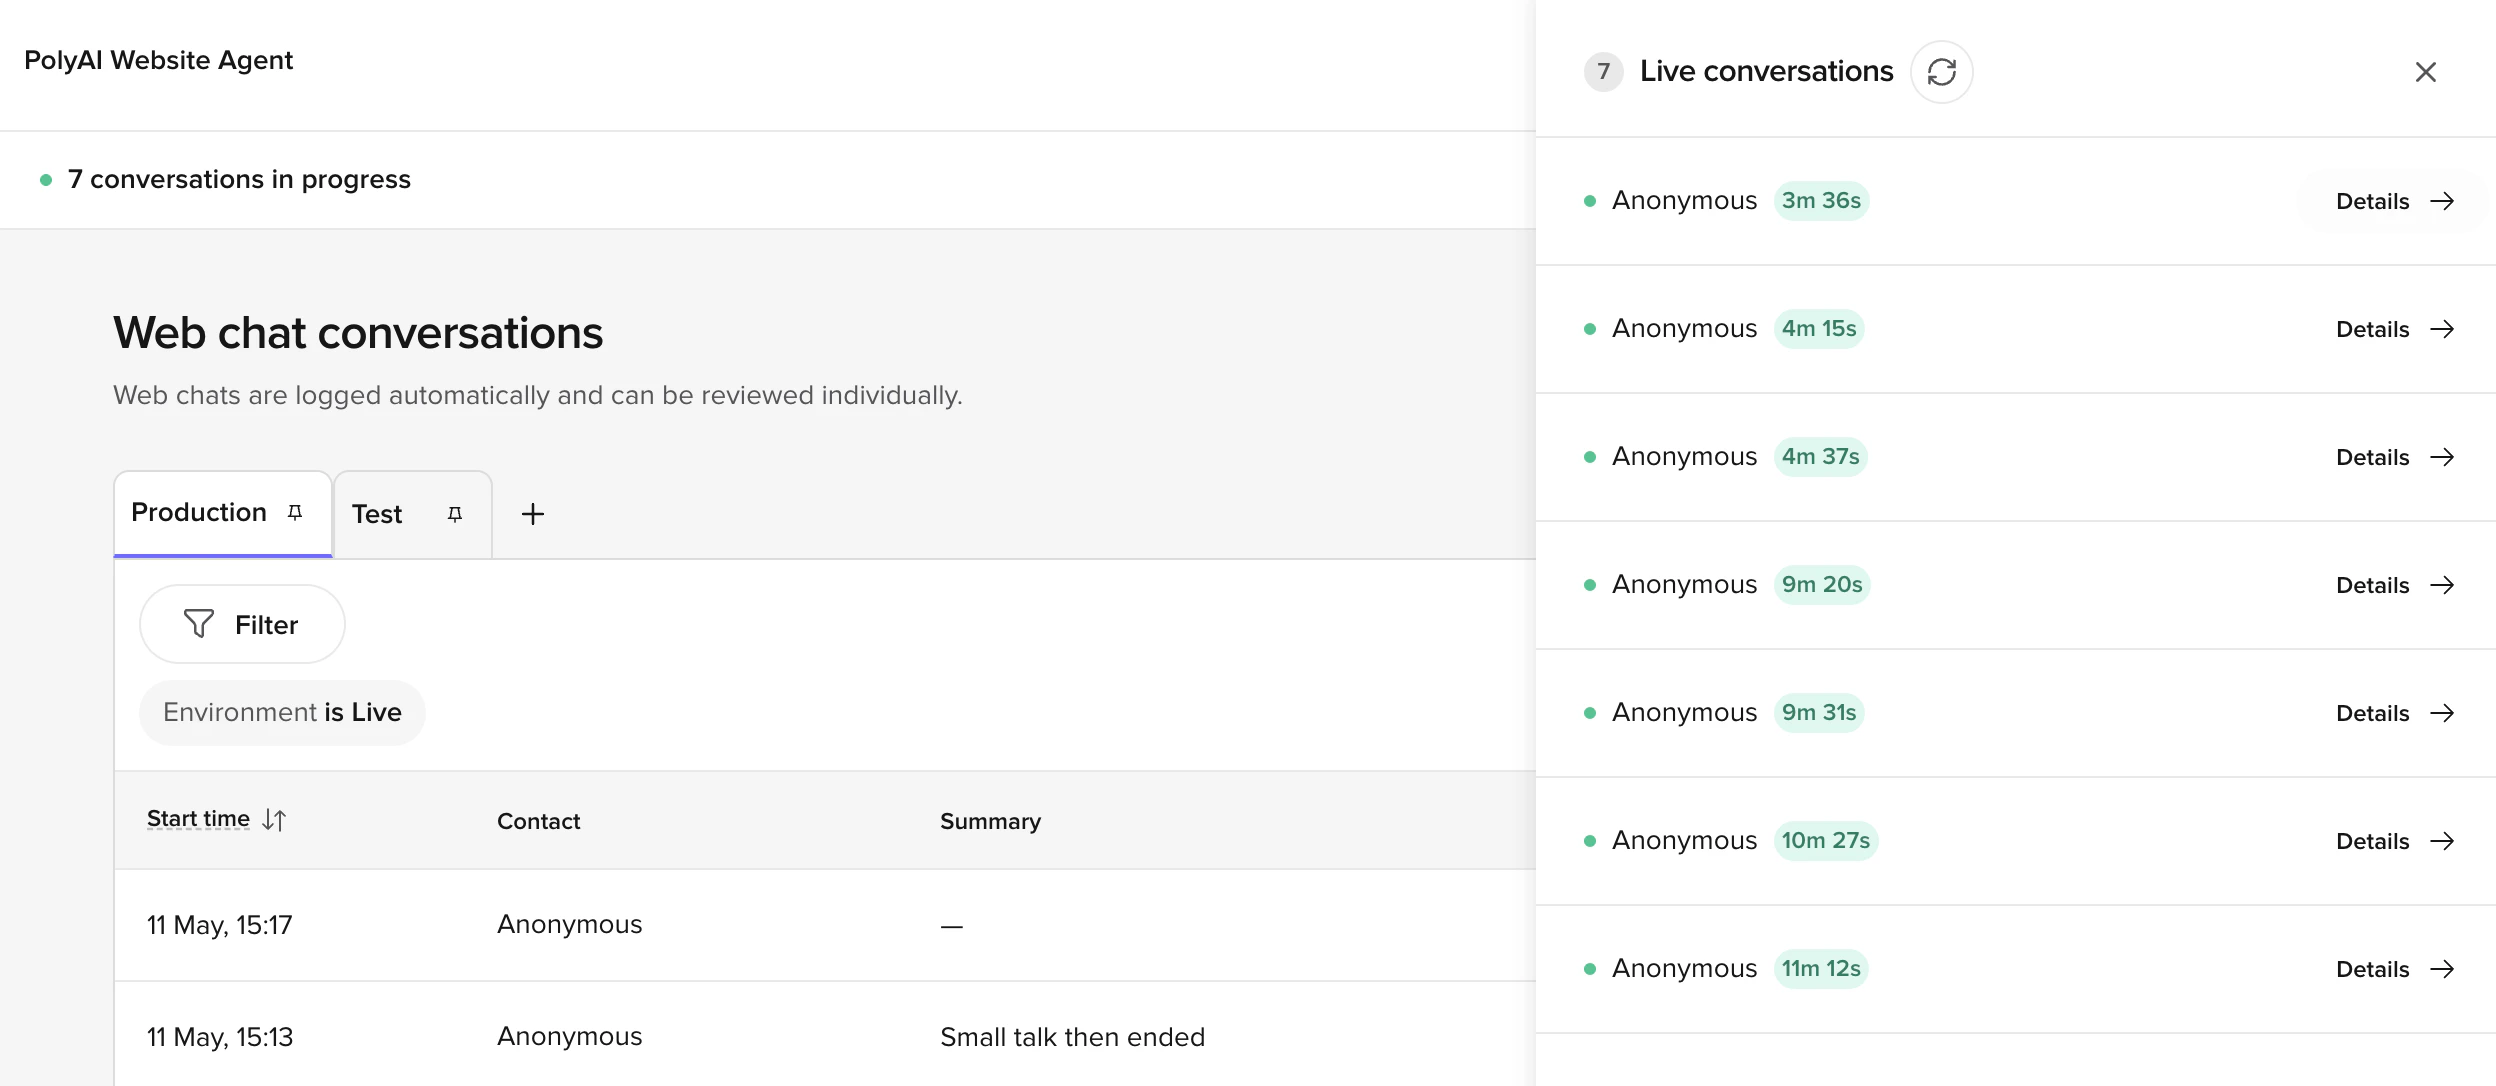
- Lists every live conversation in the current scope (Voice or Web chat), with contact and elapsed duration.
- Updates in real time as new conversations start and existing ones end.
- Includes a refresh button to force an immediate poll.
- Details → on any row opens that conversation in the standard review side panel, where you can watch the transcript stream in turn by turn.
Viewing live conversations requires PII-level access — in-progress transcripts can’t be redacted in real time, so users without PII access get an access-denied response.
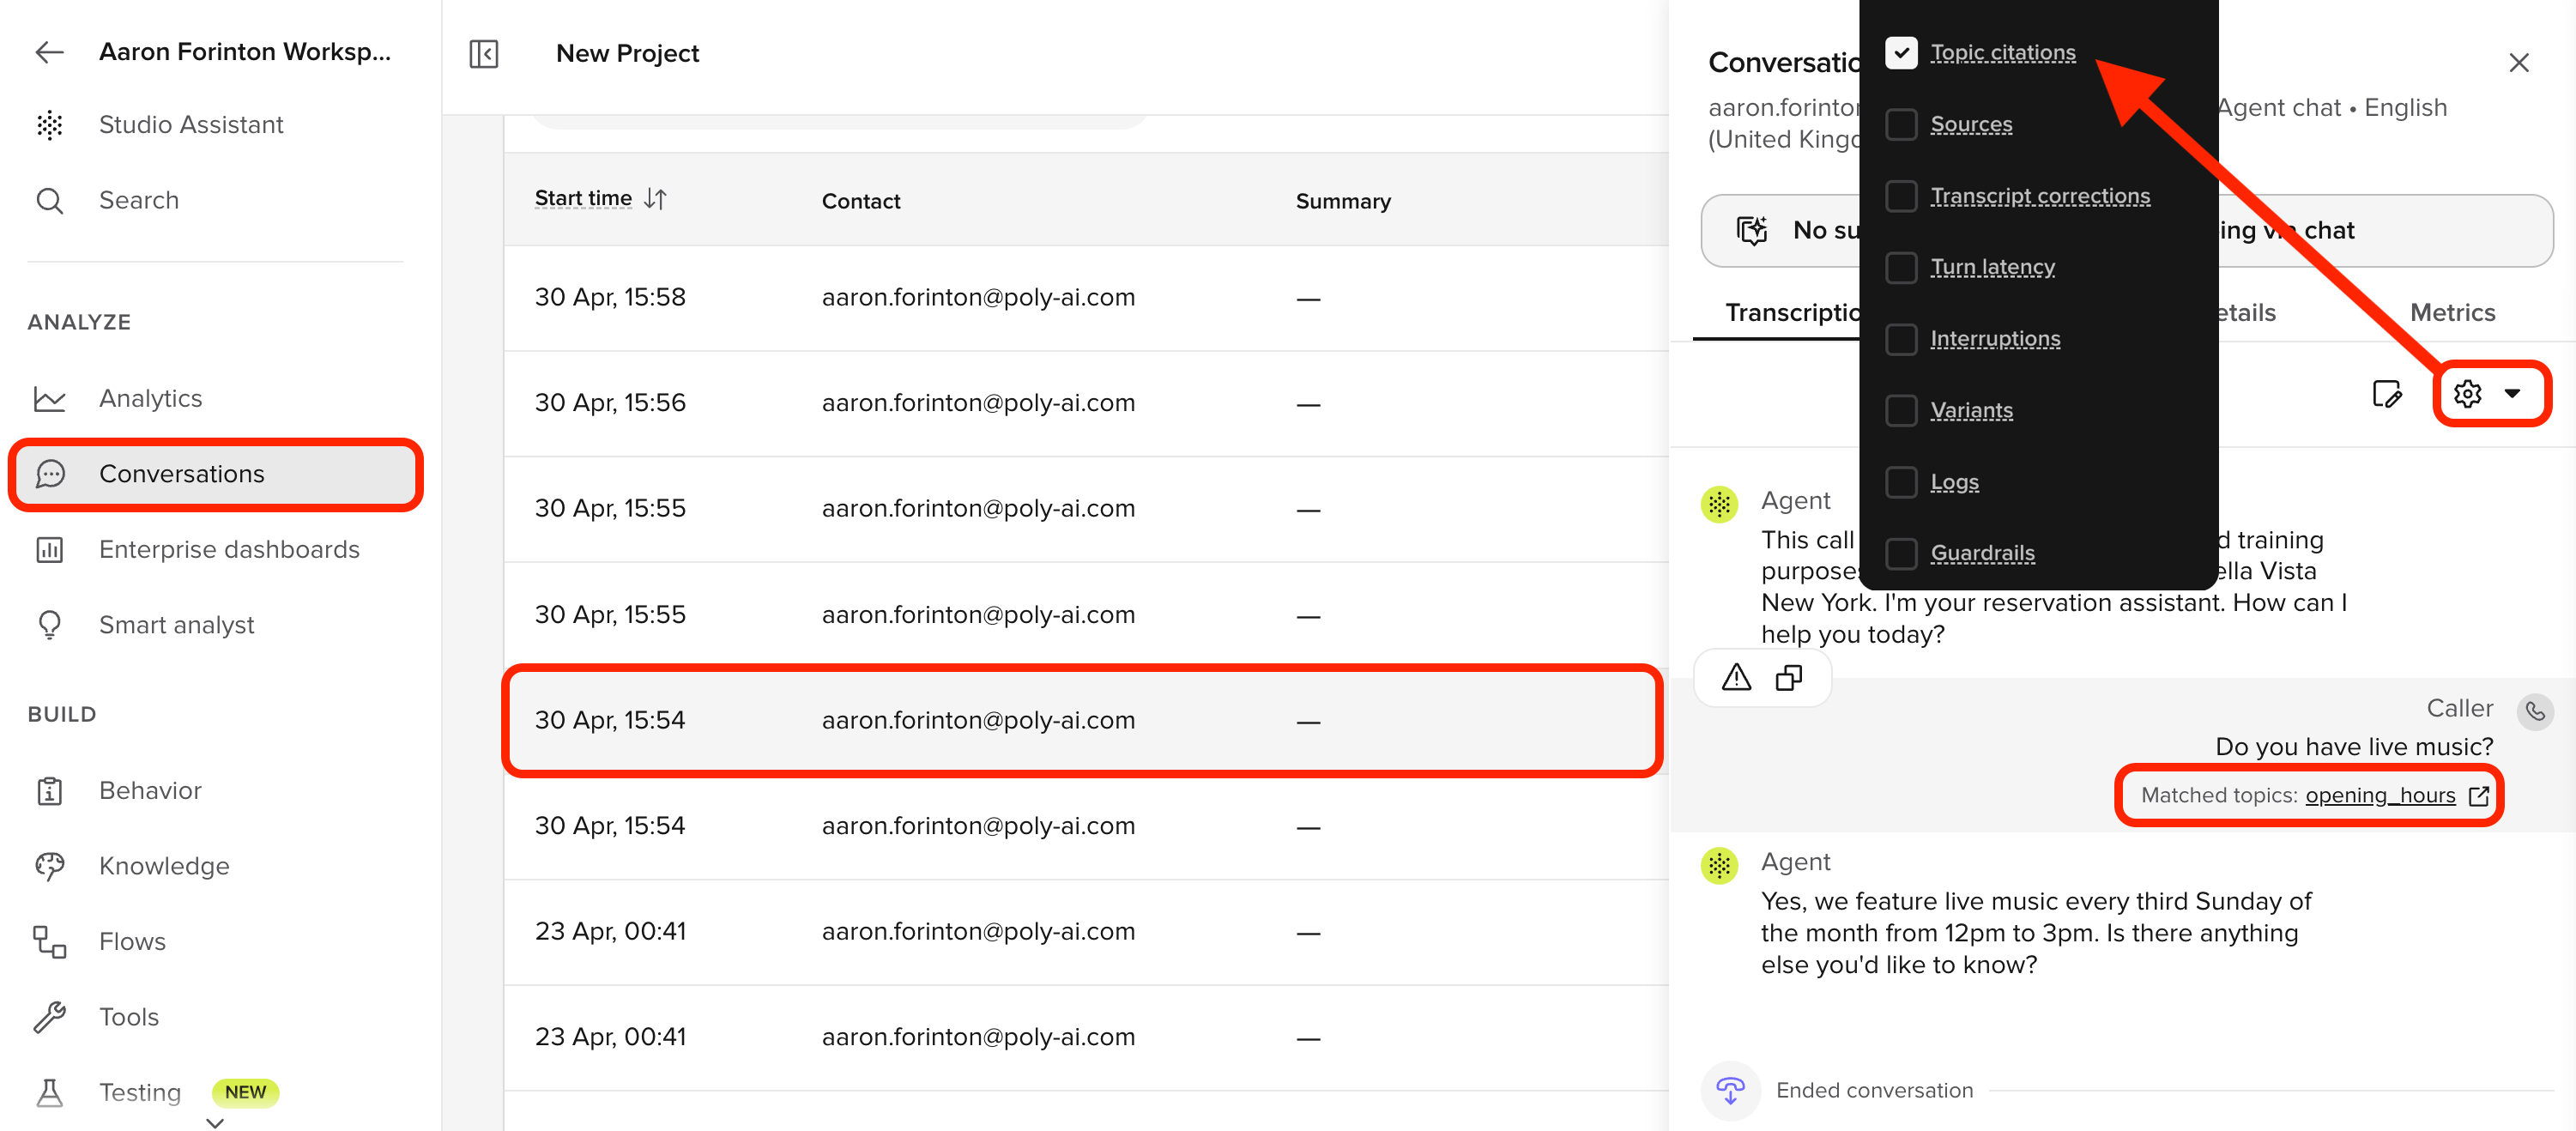
Review side panel
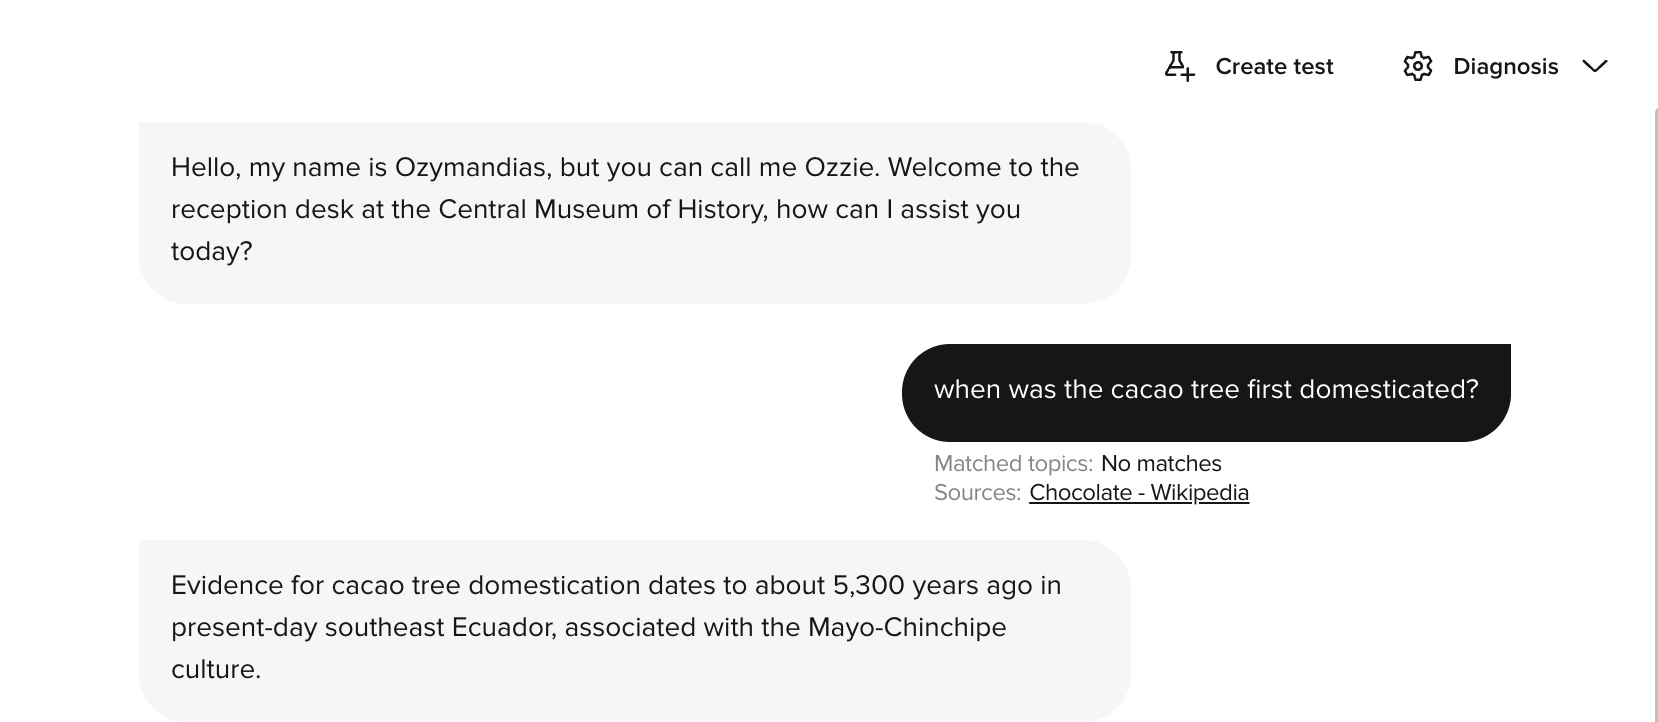
Clicking a row opens the Conversation Review panel on the right. The panel header shows the timestamp, channel type, and detected language. For webchat sessions, the contact email also appears.
A display-settings gear dropdown in the panel controls how the transcript is rendered — for example a Topic citations toggle that shows or hides matched-topic tags beneath each turn.
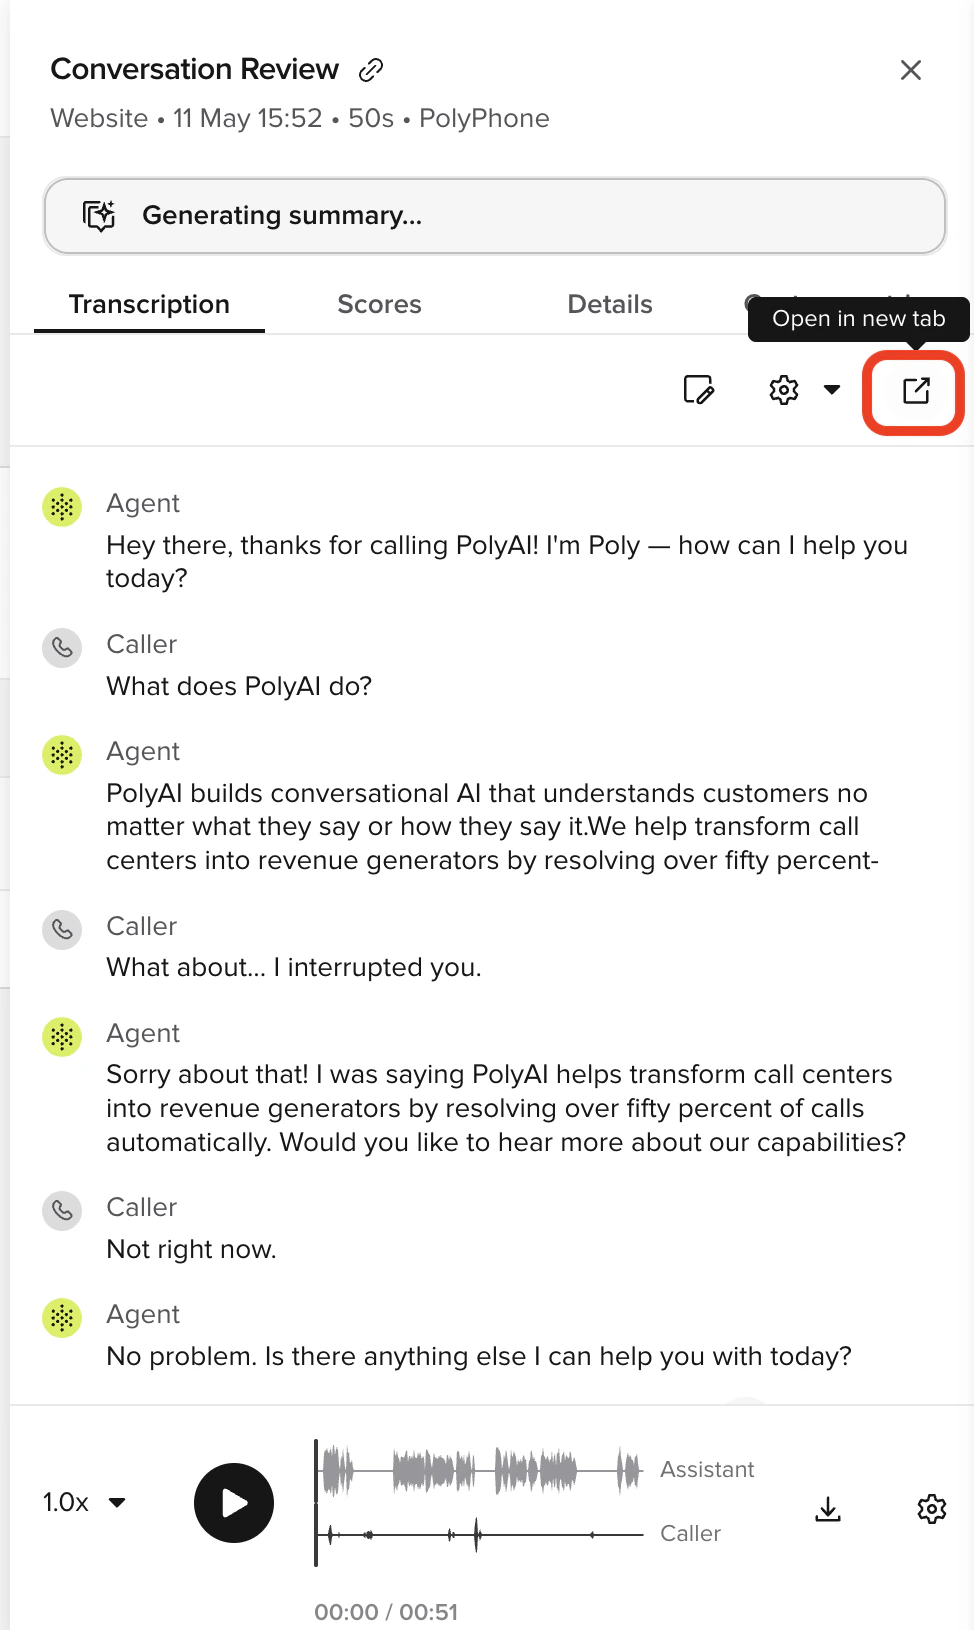
Webchat sessions do not have AI-generated summaries. The panel displays a “No summary due to conversation being via chat” notice where the summary would otherwise appear.
Full-page review
Conversation Review can also be opened as a dedicated full-page view — either by clicking Open in new tab from the side panel, or by following a deep-linked URL (for example, a link shared from Slack or a ticket).- Conversation tabs: Switch between Live, Ended, and All to focus on active or completed calls.
- Conversation turns: Shows agent and user utterances in chronological order. Live calls will appear here and they will update automatically as new turns arrive. Each turn may display matched Knowledge topics where relevant.
- Caller identity: Displays the user email address if available (for Webchat), or phone number if applicable. Personally identifiable details are shown only to users with PII-level access. For users without PII access, caller phone numbers are automatically redacted as
REDACTEDin the conversations list – inbound calls hide thefrom_number, and outbound calls hide theto_number. The opposite number is preserved so you can still tell which line was used. - Environment and metadata: Includes information such as variant name, timezone, timestamp, environment (e.g. Sandbox or Production), and version ID. Active calls display a live duration indicator beside the environment label.
- Matched topics: When topics from the Knowledge area are referenced or triggered, they are shown as tags beneath the corresponding utterance.
- Sources: When the agent retrieves content from Sources sources, a Sources tag appears beneath the turn. Click a source name to open an inline preview panel showing the retrieved content. Enable this layer from the Diagnosis dropdown.
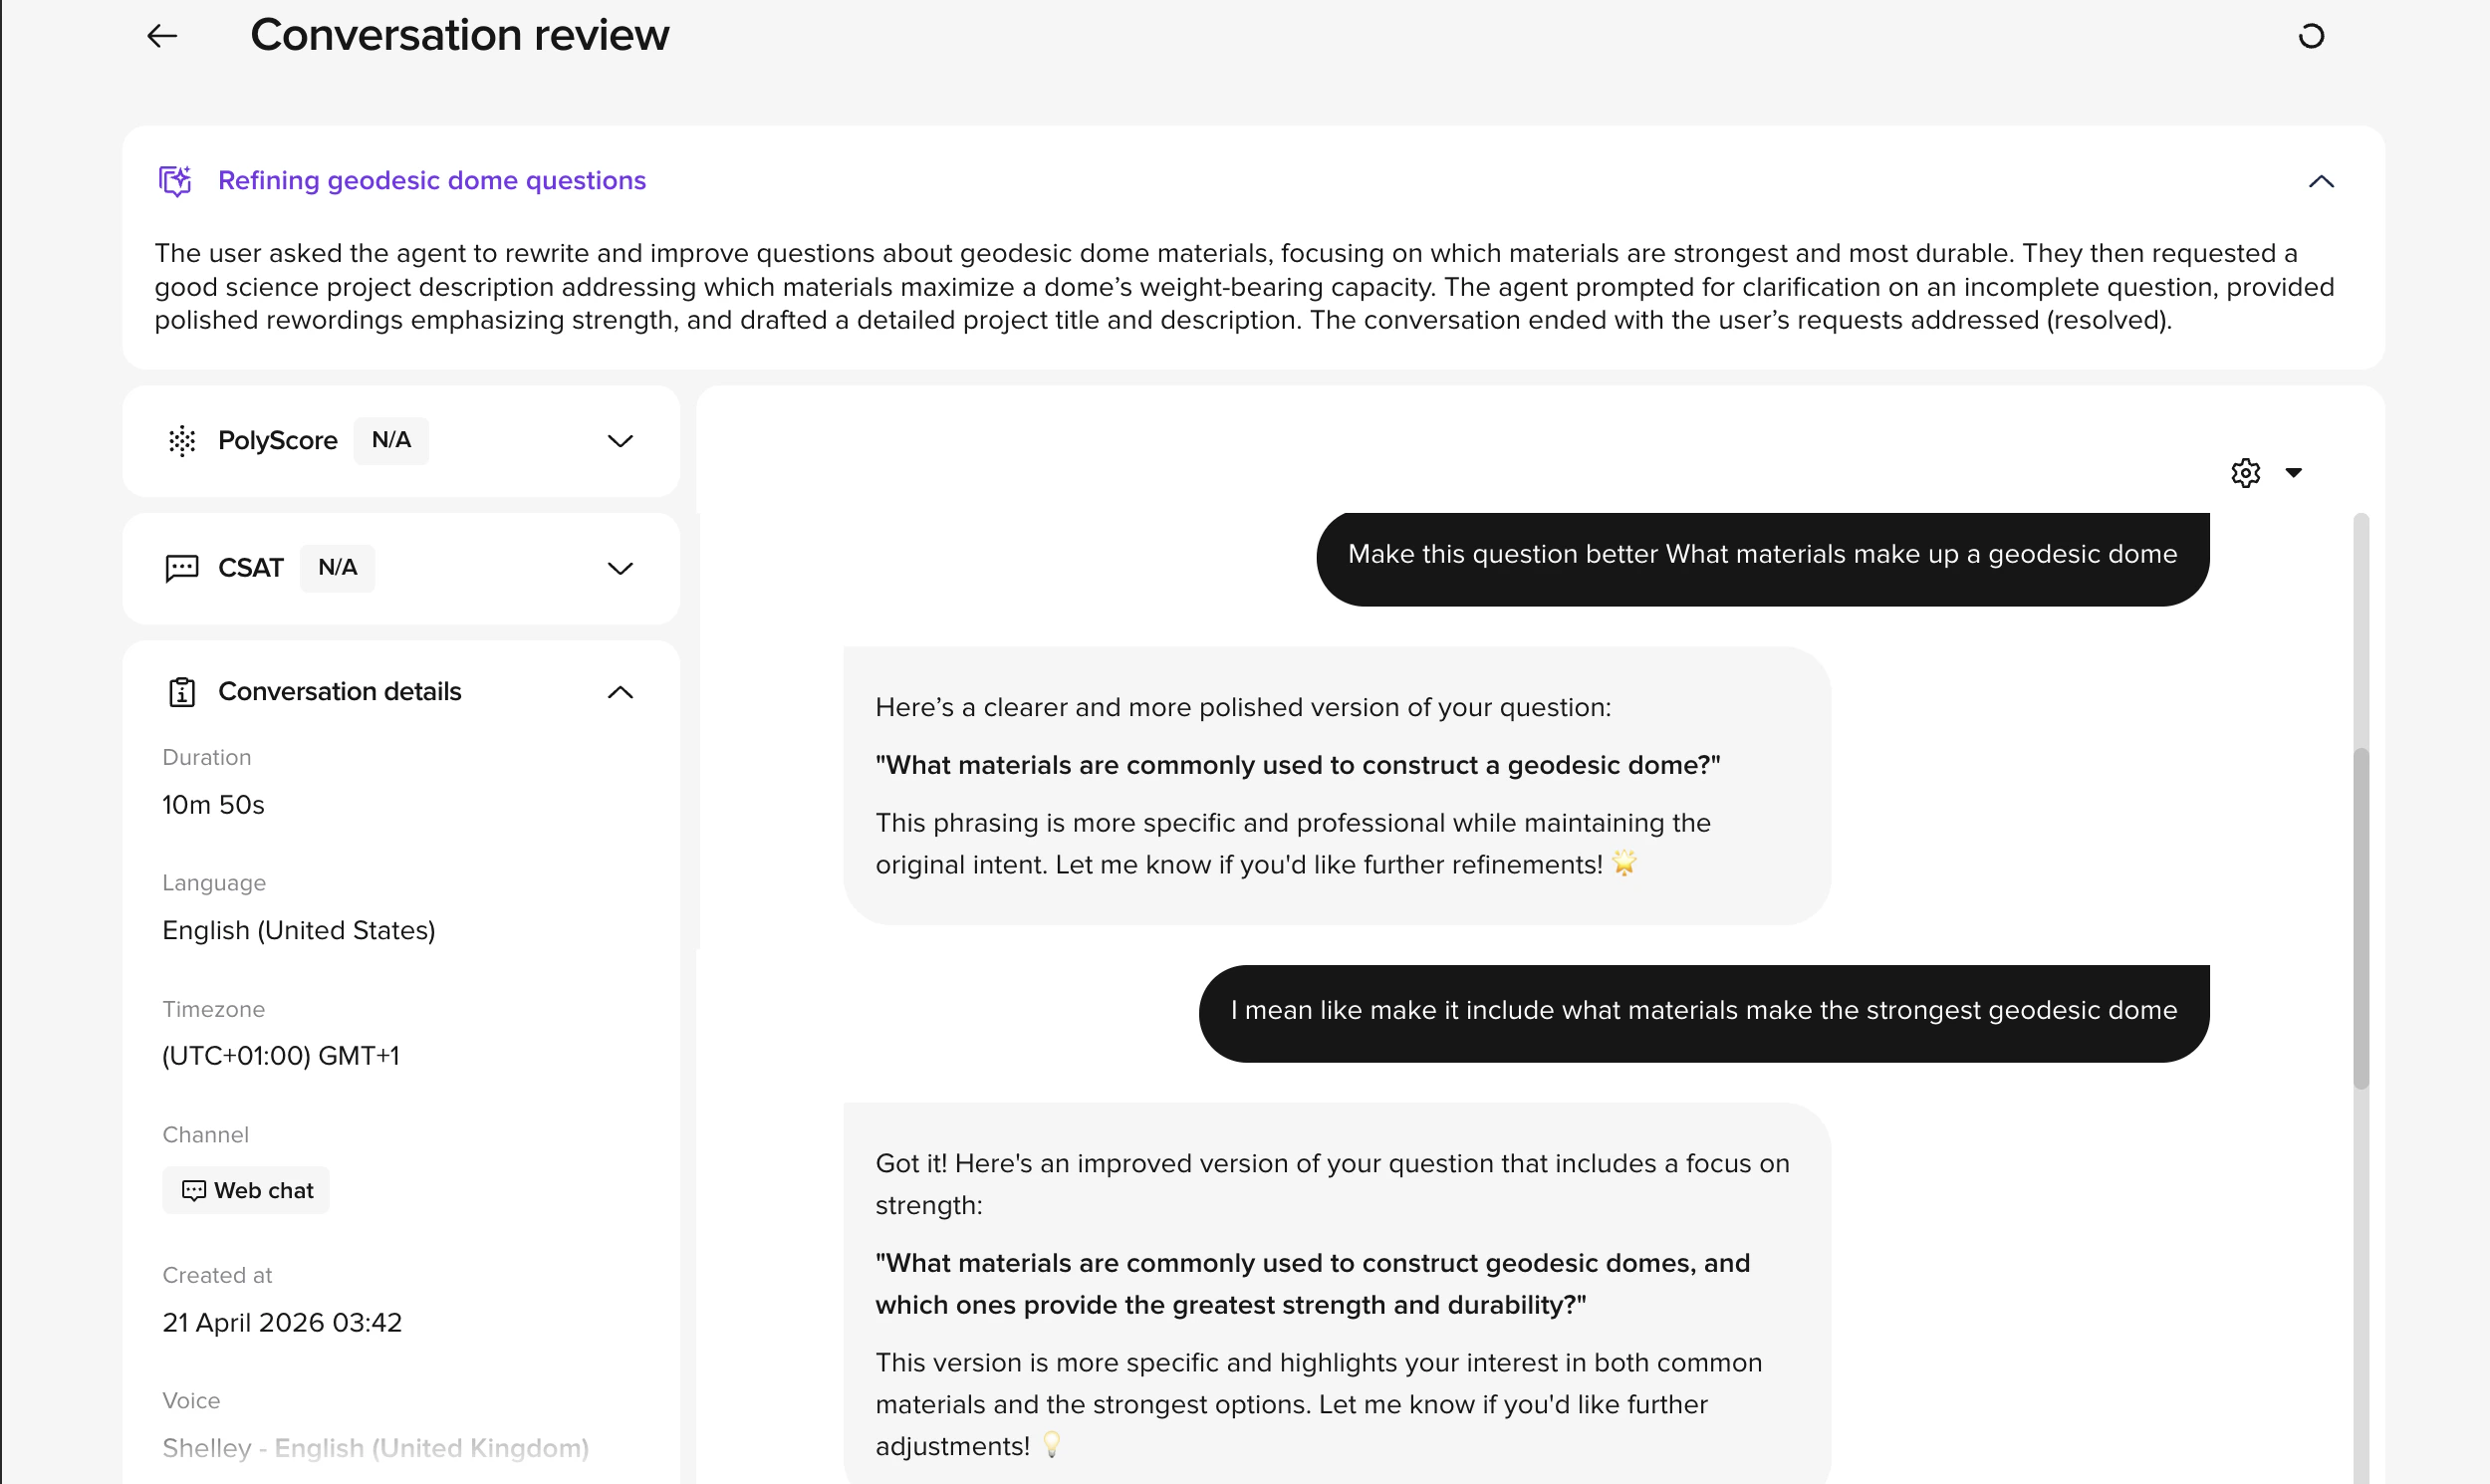
- Header — back arrow to return to the previous page, conversation title, and a reload button to fetch any new turns.
- Summary banner — the AI-generated Call summary at the top, expandable for the full text.
- Left column — stacked cards for PolyScore, CSAT, Conversation details, and Metrics (pre-built and custom). Each card collapses independently.
- Right column — the full transcript with the Diagnosis toggle group (cog icon) controlling which layers overlay each turn.
Columns
Click Column in the table toolbar to configure which columns are shown and in what order.Visibility
The Visibility tab lists all available columns with a toggle for each. Start time is always visible and cannot be hidden. All other columns under Pre-built metrics can be turned on or off: Contact, PolyScore, Summary, Duration, Language, Call SID, Variant, QA, Handoff To, A/B Group, and Environment.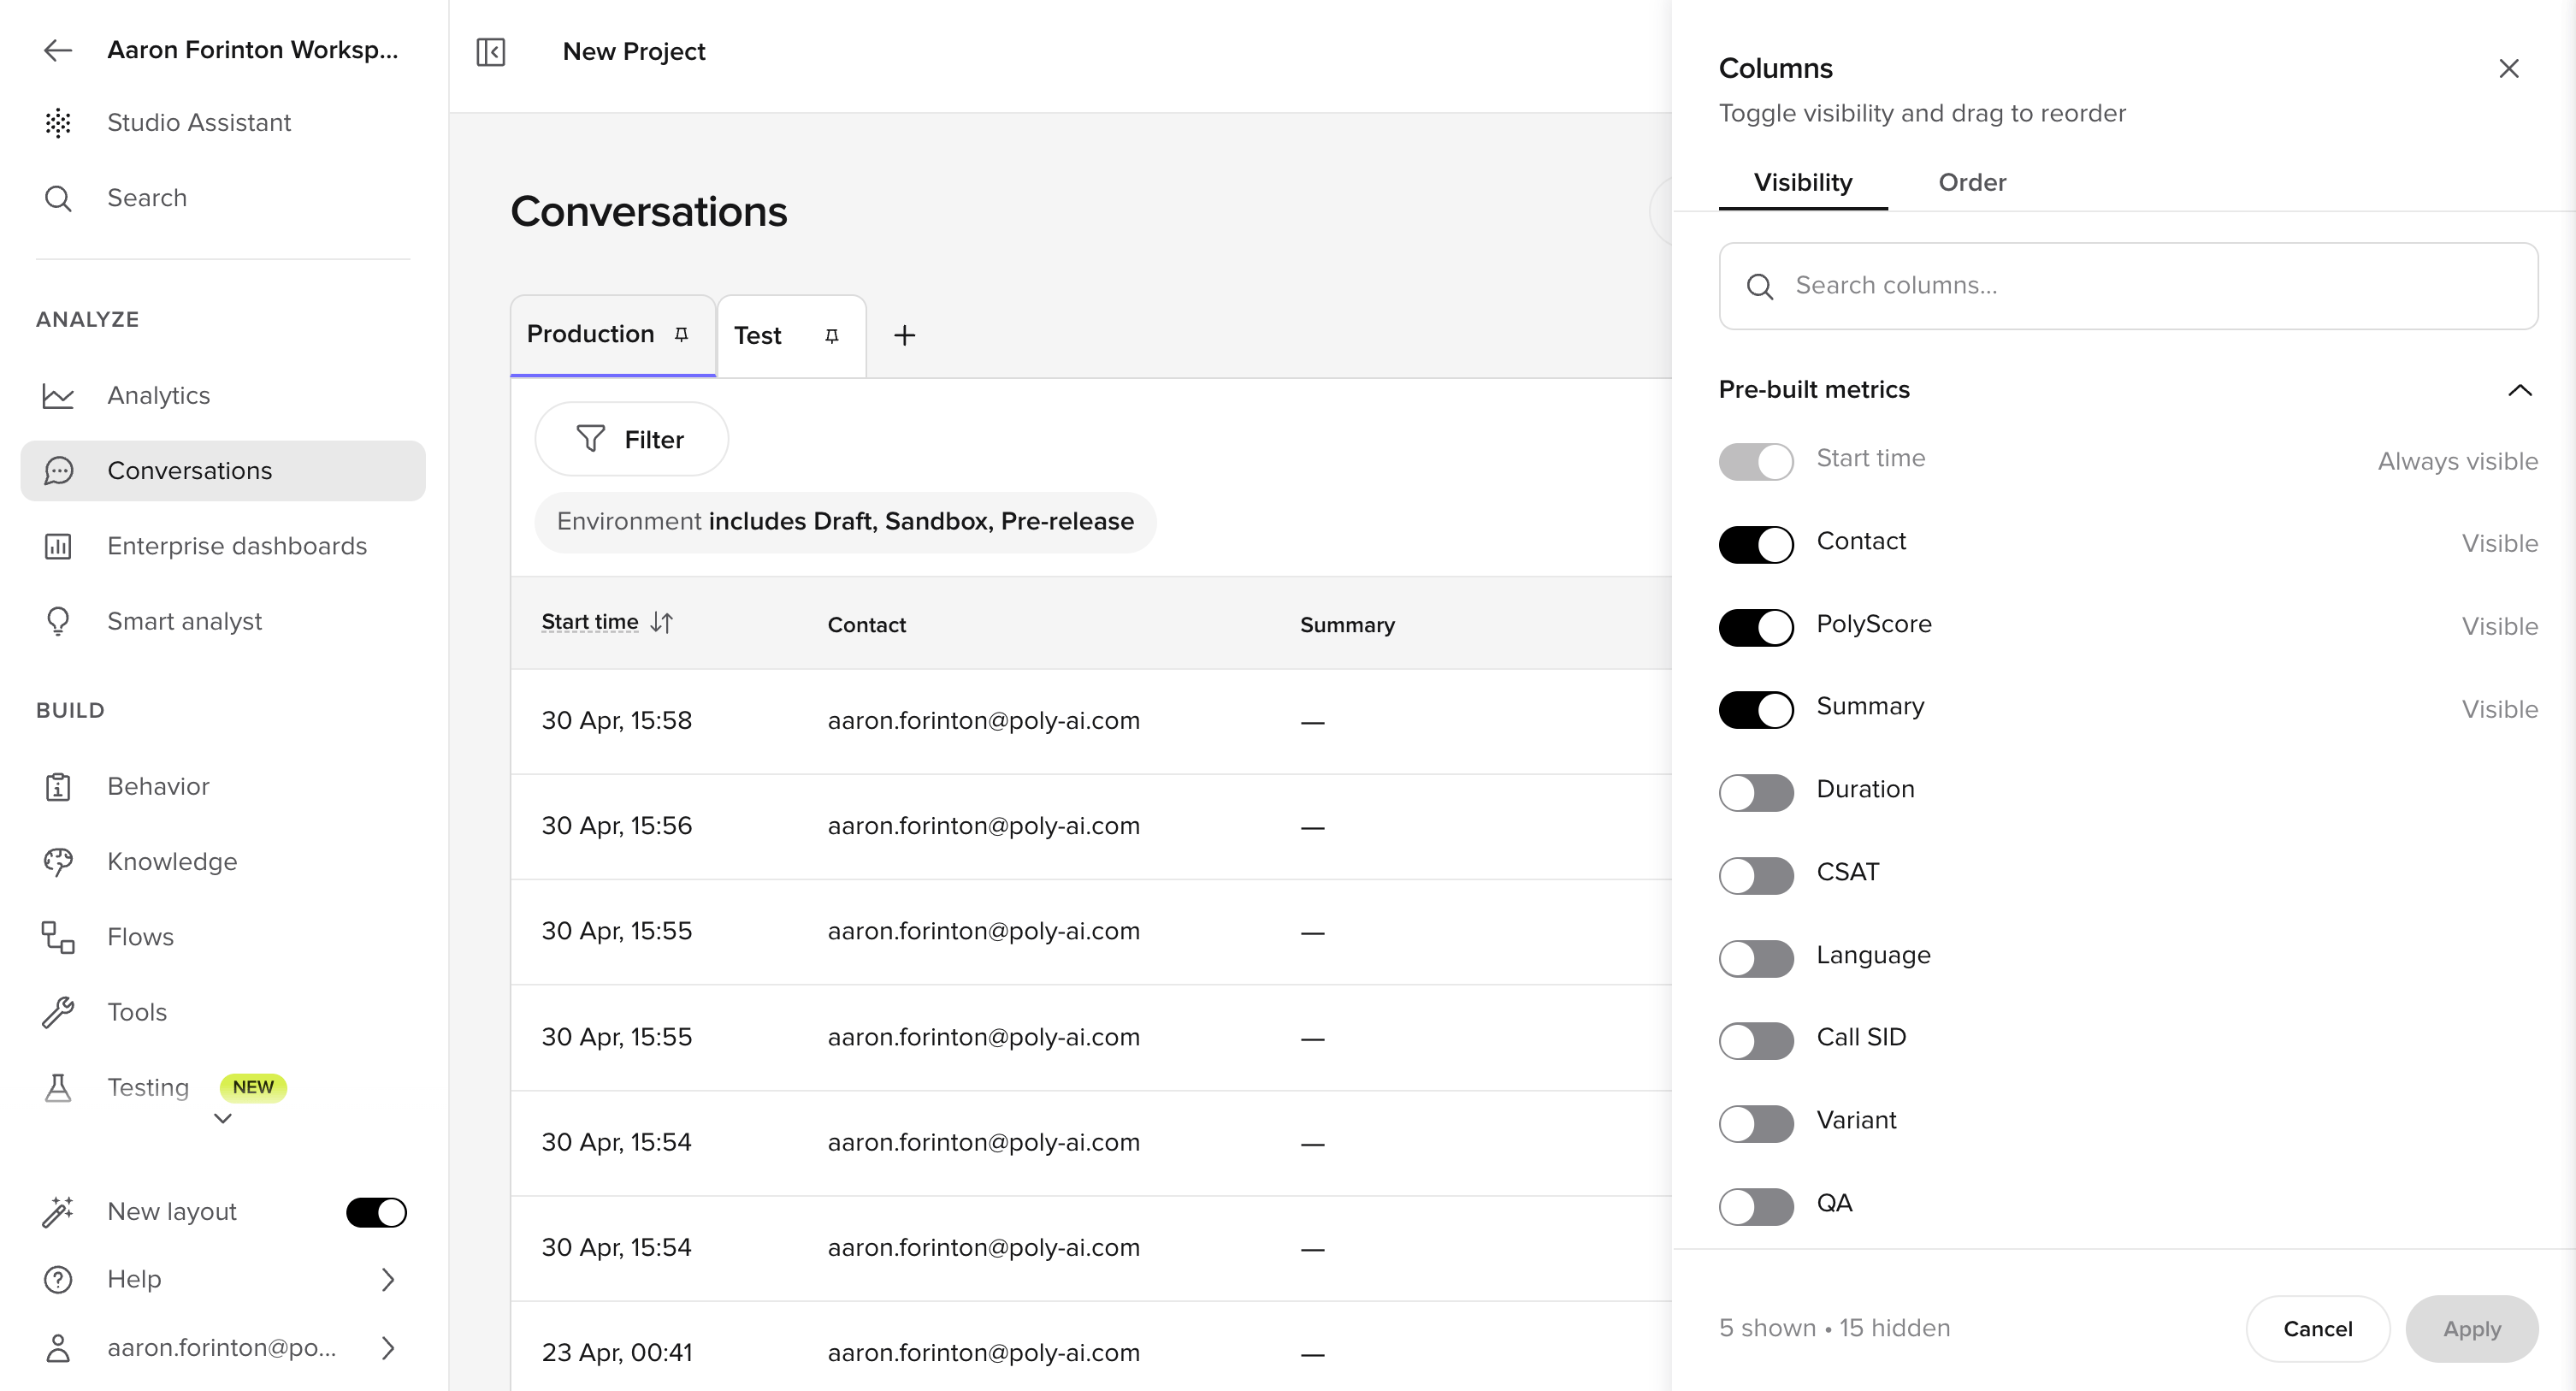
When a metric has multiple values for one conversation (e.g. several QA topic matches), the cell shows them comma-joined (e.g.
billing, handoff) with the most recent timestamp. Filtering and sorting still operate on the individual values.Order
The Order tab lets you drag columns into your preferred display order. Start time is locked as the first column.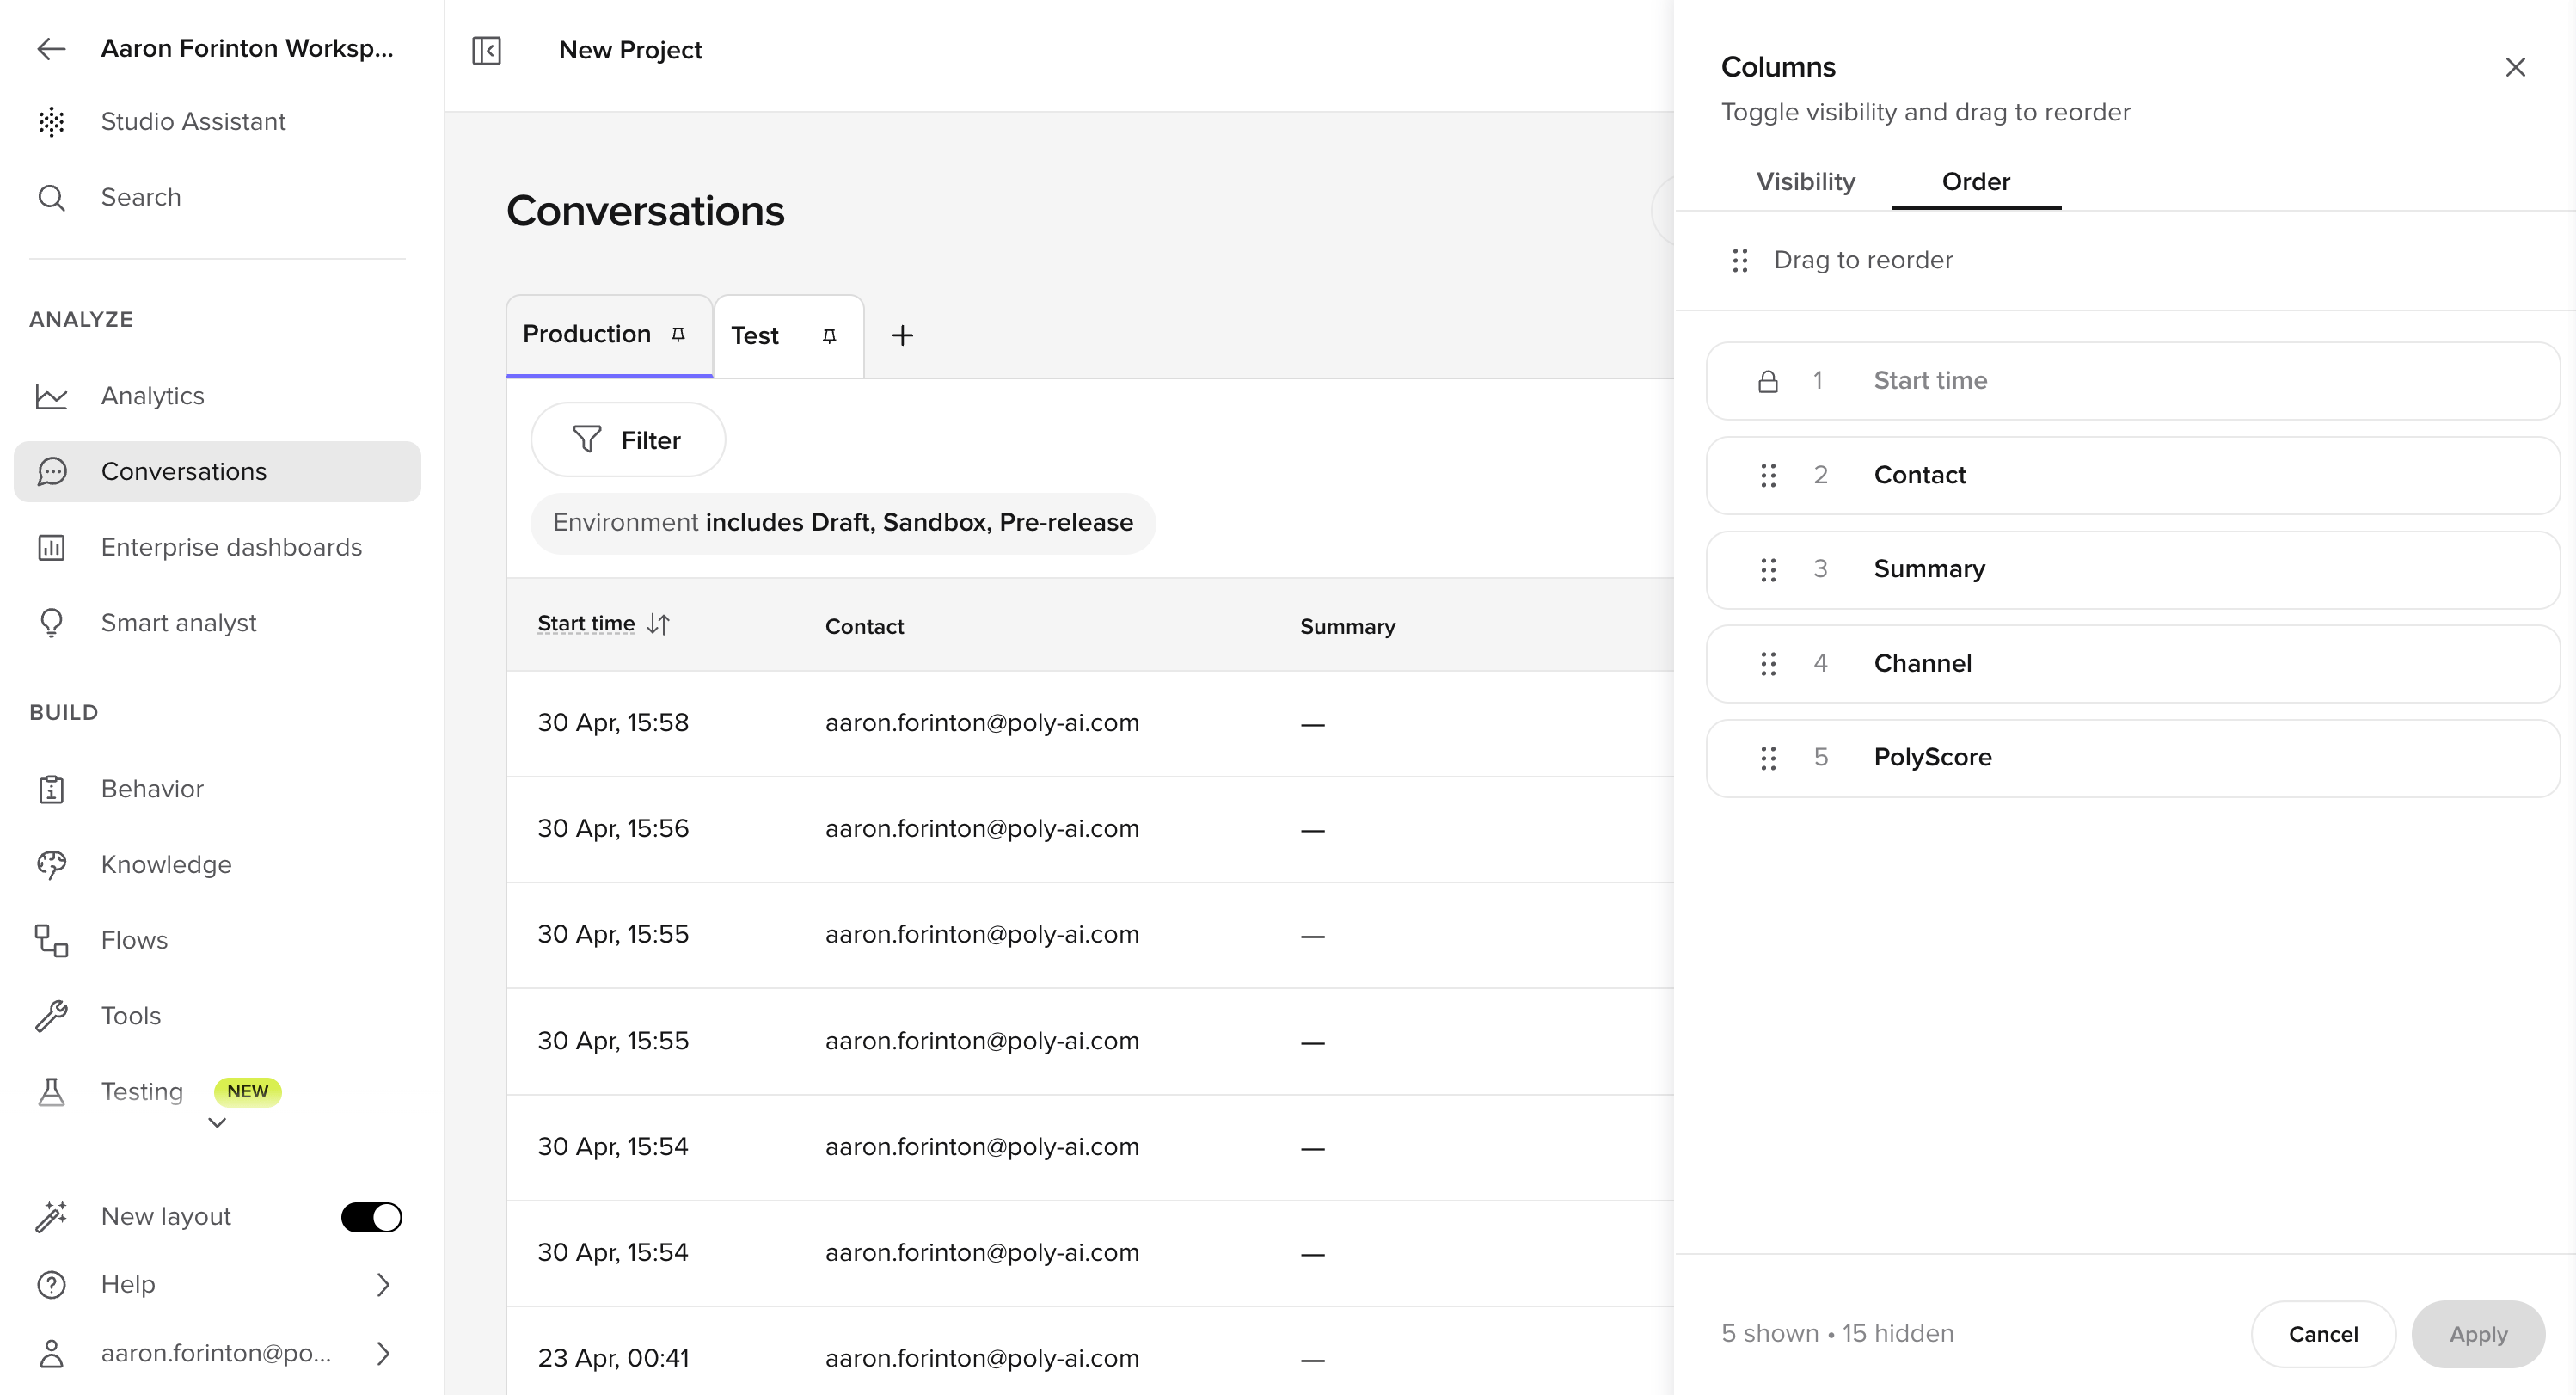
Filters
Click Filter to open the filter builder. You can add up to 10 filters per view.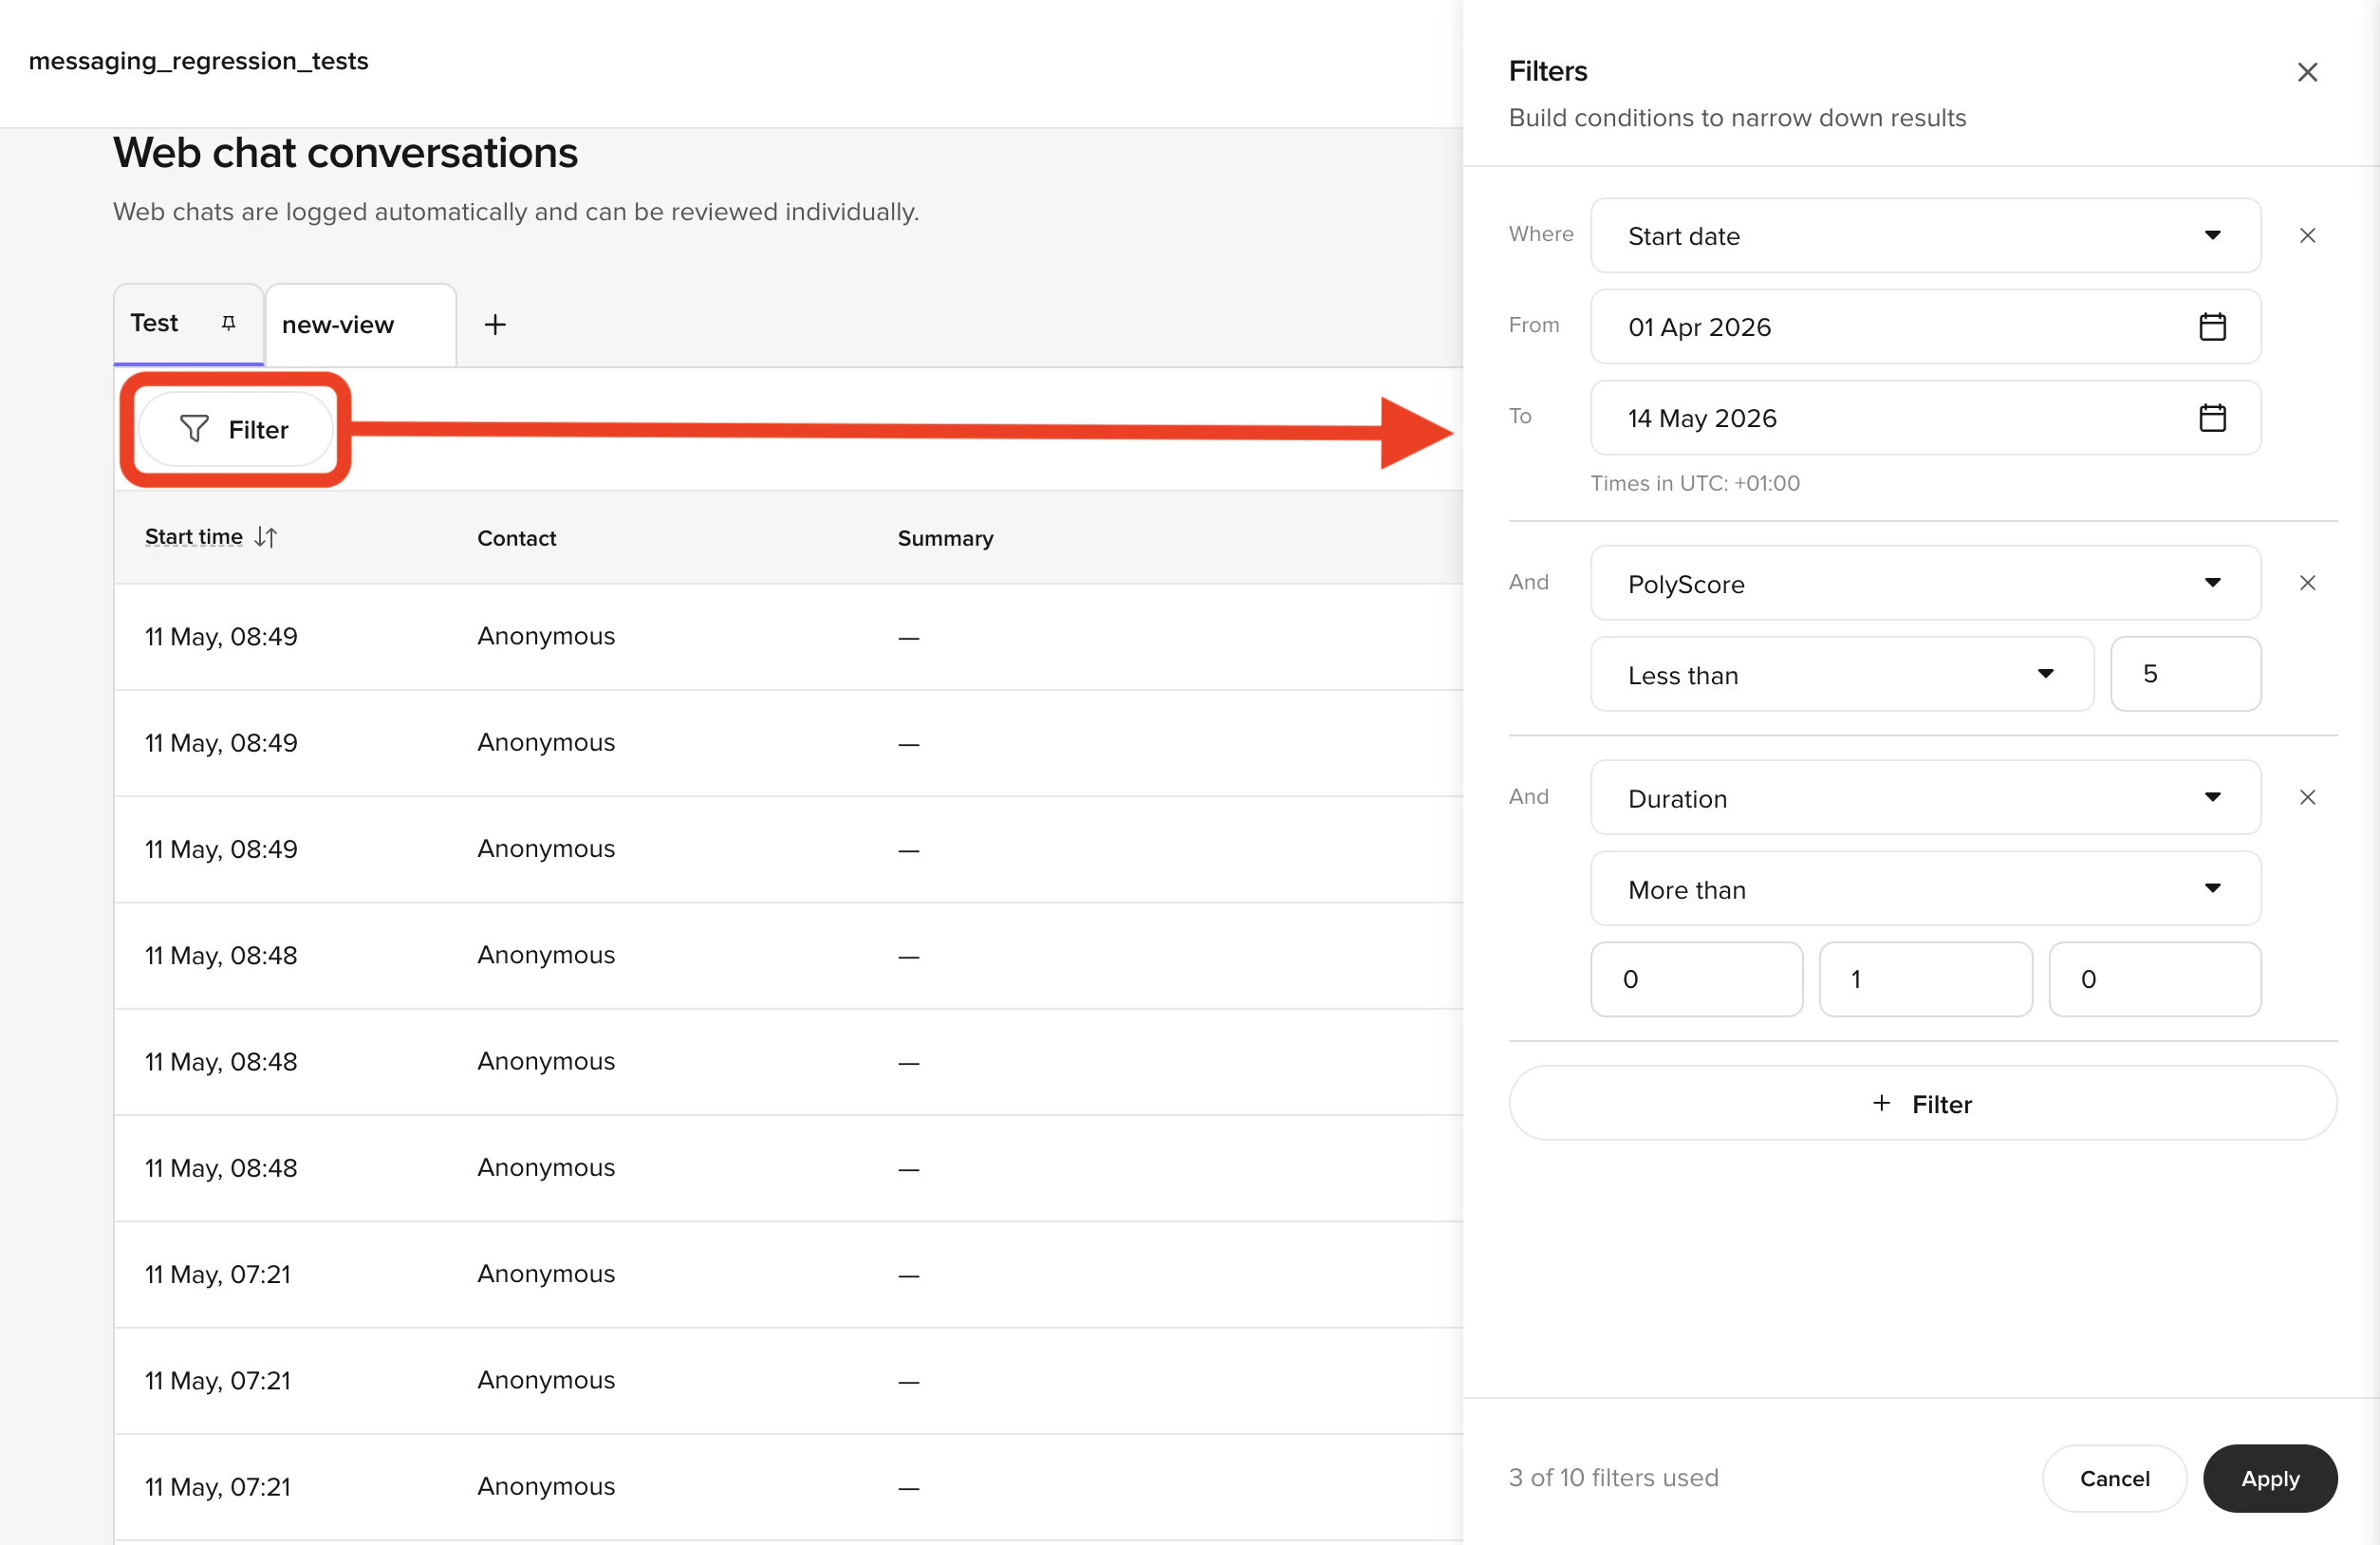
- Start date — date range picker (timezone offset shown)
- PolyScore — numeric comparison: less than, greater than, equals
- Duration — time comparison (more than / less than), entered as hours, minutes, seconds
- Environment — include or exclude specific environments
- Contact — filter by caller or recipient phone number. Matches against either the
from_numberorto_numberon the conversation, so a single value finds both inbound and outbound calls involving that number. Supports equals, contains, and not contains — use contains to match a partial number such as the last four digits. - CSAT score — filter by the CSAT survey rating (1–5) the caller gave at the end of the conversation. Supports equals, less than, greater than, range comparisons, and exists to find every conversation that has (or doesn’t have) a recorded score.
- Function calls — filter by whether any function ran, or by a specific function name (supports exists, equals, contains, not contains)
- SMS events — filter by whether any SMS was sent, or by a specific SMS event name (supports exists, equals, contains, not contains)
- Custom metrics — filter by any custom metric recorded on the conversation. String metrics support equals, exists, contains, and not contains; numeric metrics support equals, less than, greater than, and range comparisons.
Substring matching with contains and not contains
Use contains and not contains to match any conversation whose field value includes the text you enter as a substring. Matching is case-insensitive, sopizza matches Pizza Palace and THE PIZZERIA.
- contains:
pizza— keeps conversations where the value includespizzaanywhere in the string. - not contains:
pizza— excludes conversations where the value includespizza, and keeps everything else (including conversations where the field is empty).
RESTAURANT_NAME custom metric with contains: pizza surfaces every booking taken for a restaurant with “pizza” in its name, while not contains: sms on the Channel field hides any conversation routed through an SMS channel.
Click Apply to run the filters. Active filters appear as chips above the table showing a short summary of each condition — for example, PolyScore < 3 and Duration > 1m 0s. Click × on a chip to remove that filter.
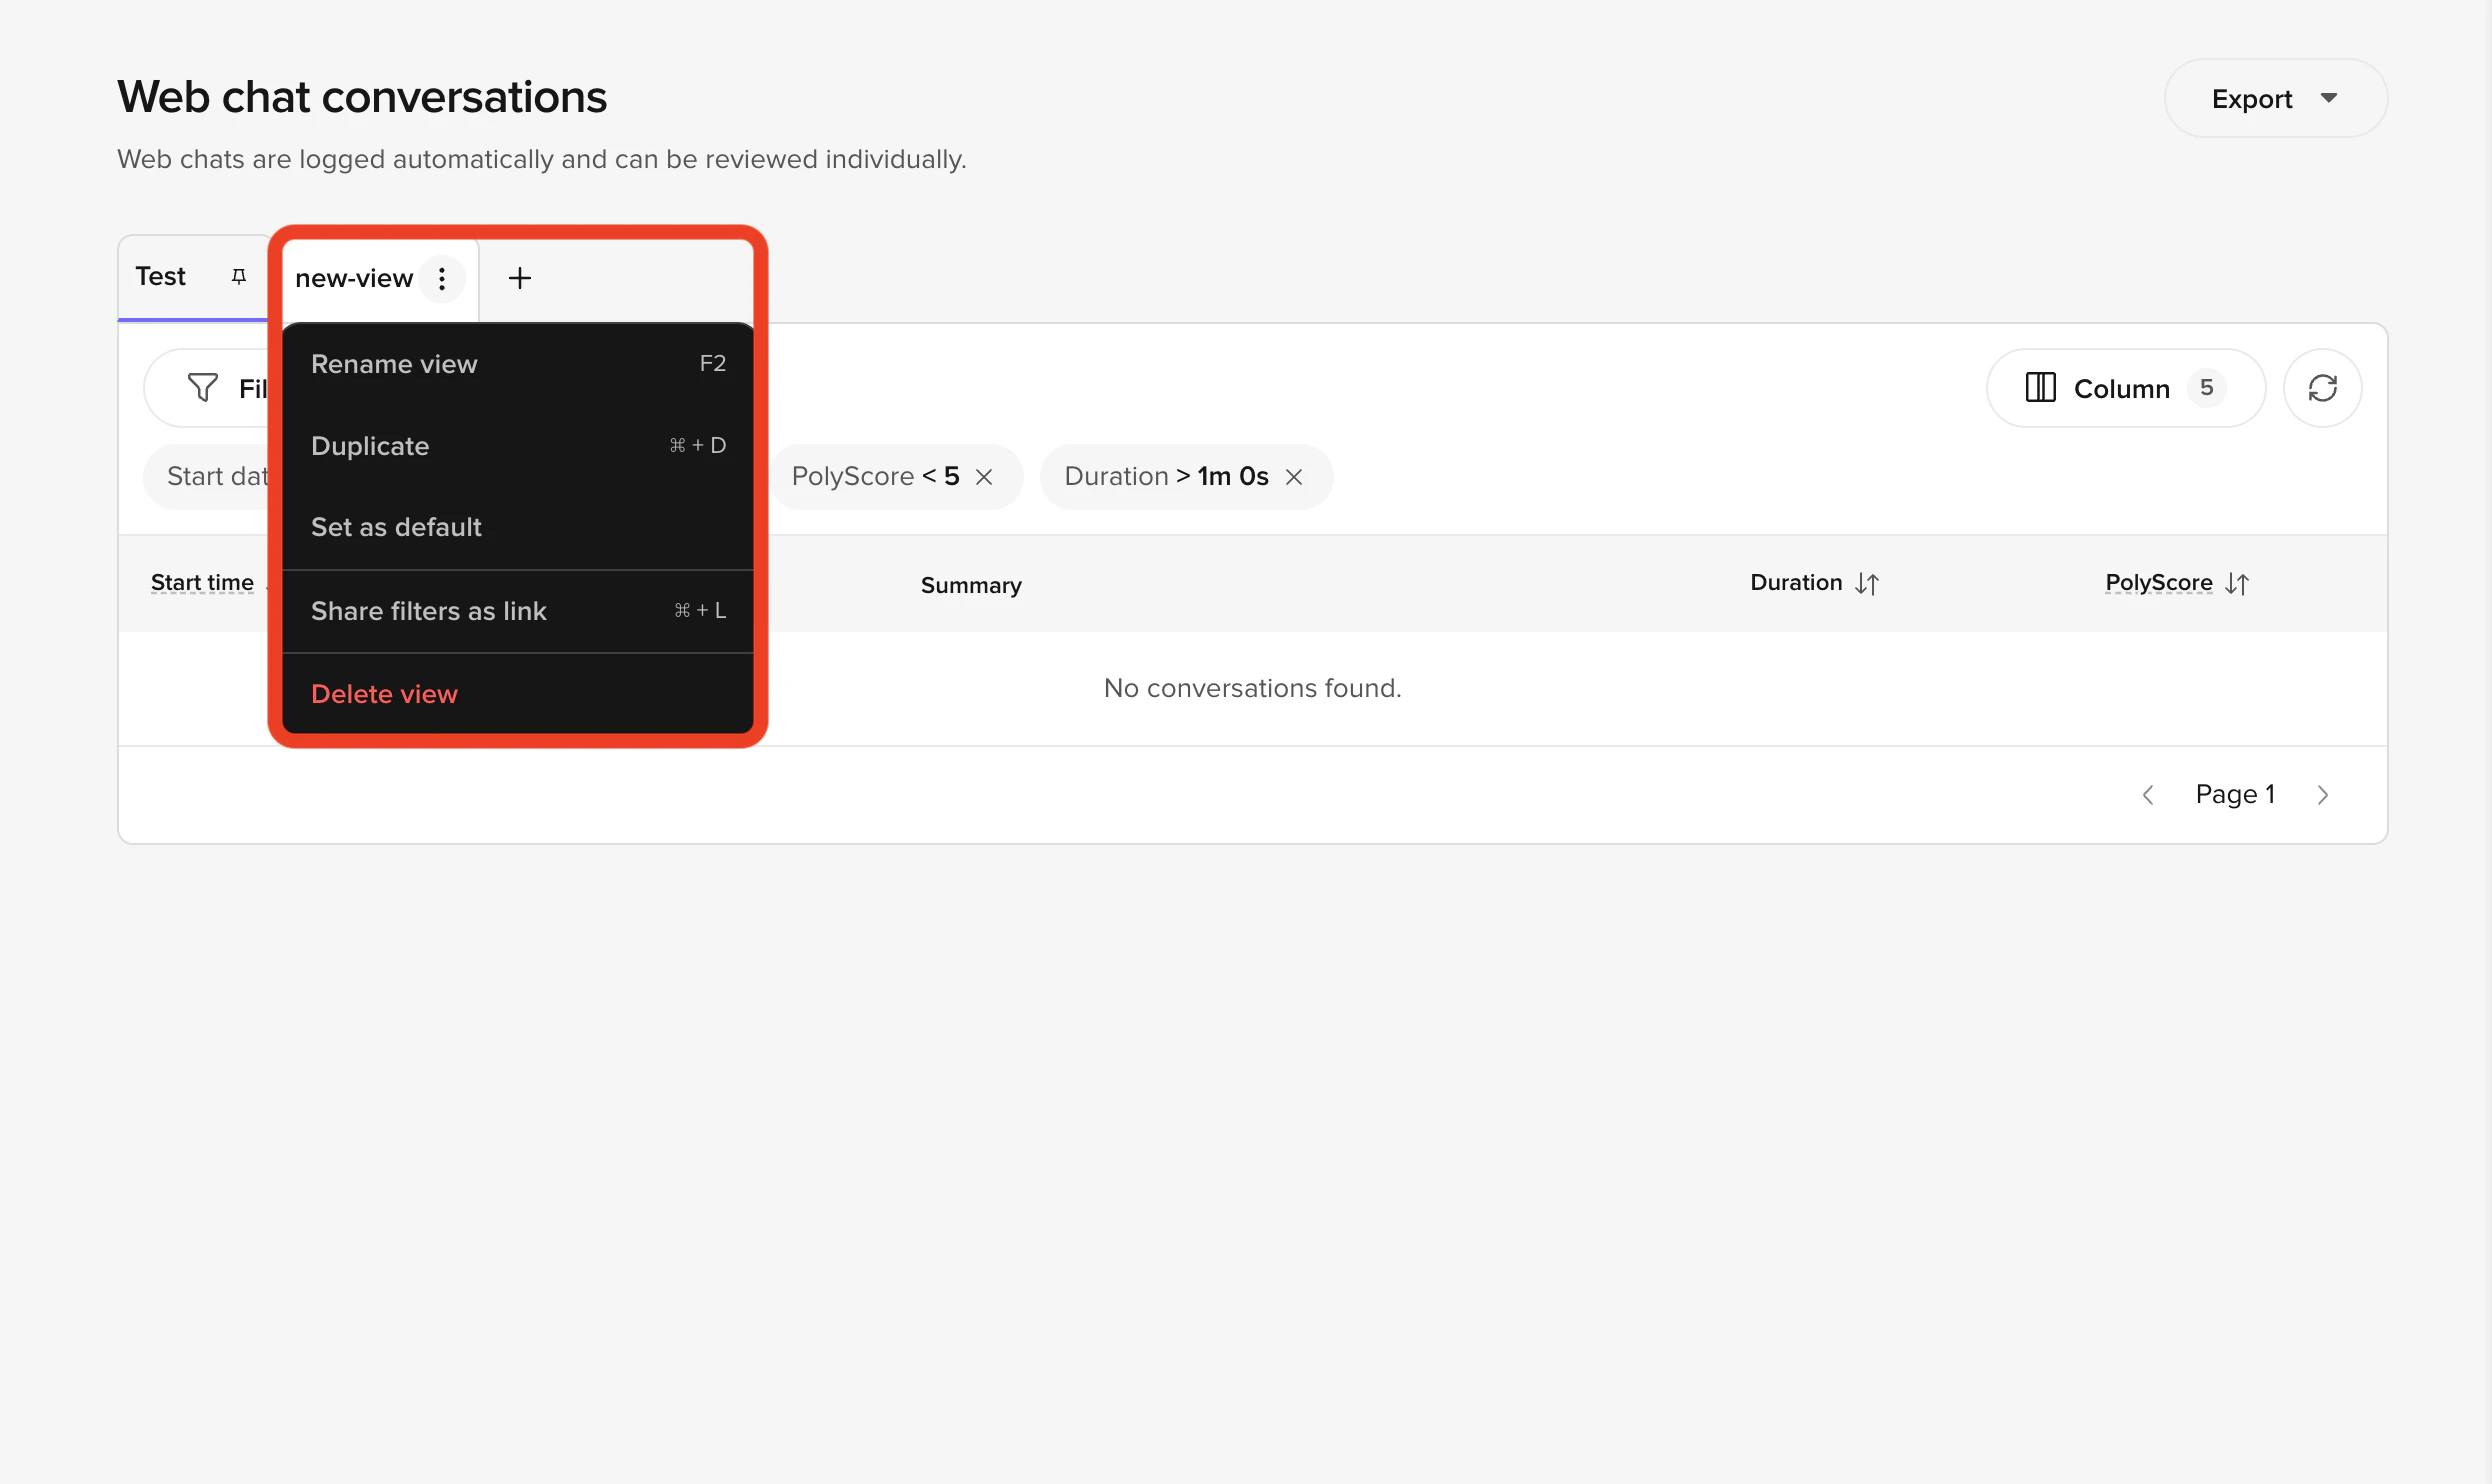
Share filters as a link
Active filters are encoded in the page URL. To share a filtered view with a teammate, copy the URL from your browser’s address bar after applying the filters and paste it into Slack, email, or a ticket. When the recipient opens the link, Conversation Review loads with the same scope, view, and filter conditions pre-applied (subject to their access permissions).Shared links reflect filter state only — they don’t pin column visibility or order. To share a full layout, save a Custom View and share the link to that view instead.
Export
Click Export in the table toolbar to download the conversations in the current view as a file. The export reflects the active view — its filters, columns, and channel scope — so refine the view first if you want a subset.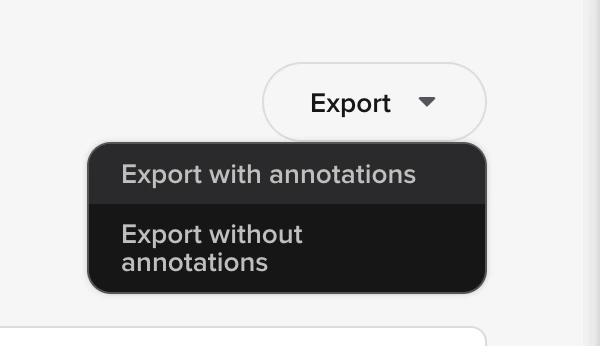
- Export with annotations — includes any annotations (wrong transcription, missing topic) flagged on the conversations in the current view. Use this when you want reviewer feedback to travel with the data — for example, when sharing low-quality calls with the team responsible for ASR or Knowledge tuning.
- Export without annotations — exports the conversations only. Use this when you just need the raw transcripts and metadata, or when sharing data with stakeholders who don’t need the QA layer.
Caller identity and PII
The panel header displays the caller’s email (webchat) or phone number (voice) when available. Personally identifiable details are visible only to users with PII-level access. When PII masking is enabled for your account, contact details are redacted in both the table and the panel.Audio playback and PII
Audio playback in the Transcription tab follows the same PII-level access rules as the rest of the panel. Users with PII access hear the original recording by default and can opt in to the redacted version. Users without PII access always hear the redacted recording — sensitive segments are muted server-side, and the option to fetch the unredacted audio is not available. The same rule applies to the public Conversations API/audio endpoint: requests from API keys without PII access return redacted audio regardless of the redacted query parameter.
Matched topics and sources
When the agent matches Knowledge topics or retrieves content from Sources sources, both surfaces appear under the relevant turn:- Matched topics — tags listing the topics most relevant to the user’s utterance.
- Sources — clickable source names. Clicking a source opens an inline preview; use Open in Knowledge to jump to the source file.
PolyScore at a glance
Every eligible conversation displays a PolyScore badge in the table and on the Scores tab — a 1–5 quality rating generated automatically by AI. The badge is color-coded (green 5, amber 3–4, red 1–2) and expands to show per-dimension breakdowns. Use PolyScore in Conversation Review to:- Prioritize review — sort or filter by PolyScore to surface the lowest-quality conversations first.
- Understand failure modes — expand the breakdown to see whether a low score reflects poor flow, an unresolved task, or caller frustration.
- Spot-check high scores — confirm that well-scored calls followed the right process before using them as benchmarks.
Conversation status
The end of every conversation is visually marked with an “Ended conversation” indicator. Live calls show an “In progress” badge until they close automatically.Default view
Each scope opens on the Production System View. If you are working in Sandbox or haven’t yet deployed to production, switch to the Test System View, or create a Custom View with your preferred filters and set it as your default.Data retention
Related pages
Views
Save filter and column combinations as pinned tabs.
Diagnosis
Inspect tool calls, flows, latency, and topic citations for a specific turn.
Annotations
Flag transcription errors and missing topics to drive continuous improvement.
PolyScore
Understand how conversations are scored and what each dimension measures.